SIGNALIZED INTERSECTION:
Location markers for the signalized intersections
UN-SIGNALIZED INTERSECTION:
Location markers for the un-signalized intersections
MAP Section:
Click the location markers on the map to view the traffic counts
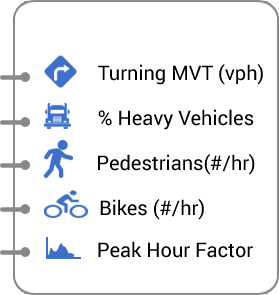
CHOOSE A DATA TYPE – Located on the left of the map
Click to select the data type (i.e., turning movements, % of Heavy Vehicles, Pedestrians, Bikes, and Peak Hour Factor)
DIAGRAM – Located at the lower left of the web page
Data (i.e., turning movements, % of Heavy Vehicles, Pedestrians, Bikes, and Peak Hour Factor) available by movements
GRAPH – Located at the lower right of the web page
Graphical representation of traffic data by approach and intersection
Icon 1 (from left) - Point of interest:
Click to filter the count locations by year
Icon 2 (from left) - i:
Click to view the information page
Icon 3 (from left) - Data Summary icon:
Click to view system-wide available data
Icon 4 (from left) - Layers:
Click to view available GIS layer


 North
North


